|
Histo- comes from the Greek word for loom or web, and -gram means anything
written or drawn. In the wool industry the word histogram has come to mean the
permanent record of the quality of an animal's fiber production, as represented by
samples of fiber and the statistical information derived from them. A histogram can
be anything from an actual fiber sample taped into a notebook or a high-tech
laser-scan printout with its neat little vertical bar graphs. The graphs illustrate the
number of fibers at specific micron measurements in a given sample as well as
measurements indicating variability within a sample. A typical histogram,
incorporating laser scanning of hundreds of individual fibers, contains information
about average micron as well as the standard deviation (variability in a fleece) and the
coefficient of variation (another measure of variability).
The laser-scan histogram is very much a part of the evolving alpaca business in
North America. Histogram results are used either to accept or reject inbound alpacas
that are candidates for inclusion in the Alpaca Registry. And histograms are often
affixed prominently to clipboards on the pens of animals being displayed at shows
or sales at numerous venues across North America. At such events a histogram is
transformed from an internal document that assists in the phenotypic assessment of
an animal to an advertisement that attests to the animal's fiber quality. Used as an
advertisement, the histogram assures prospective buyers of the alpaca's competitive
fiber-producing powers. The unverifiable assumption of any such histogram is that it
actually represents the animal it claims to represent. I would wager that most
breeders listen to their consciences and submit samples for testing that are from the
animal they say it came from. But because histograms have become an advertising
statement, it is important to note that the testing laboratory merely tests samples and
has no method of matching a sample to a particular animal, other than relying on the
information provided by the sender. Relying solely on a histogram has its limitations.
For this and other reasons, learning how to assess fiber quality through visual and
tactile means makes good sense for anyone seriously considering entering the alpaca
business.
While many North American breeders embrace the security and certainty that
histogram results appear to offer in assessments of fiber quality, in South America
(even among those with the means to use histograms) the traditional, highly refined
tactile method continues to be relied upon. Peter Kothe, formerly Michell�s top raw
fleece buyer in Arequipa, Peru, says, "The alpaca processing business relies on the
fingers of the women who sort our fiber." The officials overseeing the recent
International Camelid Festival in Arequipa felt strongly enough about this method of
assessment to politely forbid North Americans attending the festival from taking
fiber samples from champion alpacas for laser -scanning purposes. The point was
well taken: What good would come of a scientific test by a bunch of gringos of
animals whose owners could never afford such a test and who have relied on tactile
testing for centuries? The sensory experience of high-quality alpaca fiber is
unquestionably a distinguishing aspect of alpaca's special appeal to natural-fiber
aficionados, especially those who have developed the skill to tactilely assess it.
Still, the technology of laser scanning affords an objective insight into fiber
production not available until relatively recently. There's no question that a
histogram analyzing a sample of hundreds of fibers is a valuable tool for the
serious breeder and a convenient aid for the novice who is "tactilely challenged" and unable
to distinguish between steel wool and a vicu�a garment. It doesn't take long for the
newest novice to learn the histogram sales pitch: the lower the micron count, the
lower the standard deviation; the fewer the microns over 30, the better the fleece. If
an animal's micron average is low, the seller usually makes a quantum leap to claim
that the entire animal is superior.
North American alpaca breeders are often asked, "What is a good micron count?"
When the author ran a histogram on a sample taken from a vicu�a (the probable wild
progenitor of the alpaca), its incredibly fine fleece registered an average of 12.5
microns, with a standard deviation of 4.2 and 1 percent of its fleece in excess of 30
microns. That's right - even the guard- hair was fine, less than 30 microns. The staple
was about 1 inch (2.54 cm). An impressive alpaca histogram may have an average
micron of 20 or below with a standard deviation of around 3 and a coefficient of
variation of 16, with 1 to 3 percent of the sample exceeding 30 microns and
indicating that the animal is capable of annually producing a 6- to 8-pound fleece.
But there is much more to a histogram than numbers alone, and some important
measurements, such as staple length and fleece weight, rarely find their way onto a
histogram. As for the much-talked-about micron count and standard deviation, it is
important to remember that as long as fiber is still attached to an alpaca it is not a
static medium. For example, a 10-year-old male whose micron count has crept up to
an average of 30, but with a standard deviation of 4 and a coefficient of variation of
15, and producing 6 to 8 pounds of fleece annually is also very good for breeding
purposes. When evaluating a histogram, one must always try to also understand the
many environmental factors (diet, testosterone levels, age, pregnancy, stress, and so
forth) that affect a fleece (and the histogram) as the animal matures. This latter
example of the older male is just one instance of the many factors affecting
histogram results.
Angus McColl, owner and director of the nationally and internationally recognized
Yocom-McColl Testing Laboratories, is quick to explain that while the histograms
his laboratory produces are valuable information for the alpaca breeder, each
histogram needs to be considered in its own special context. "Histograms should be
compared to other animals in the same herd of the same age," Angus says, "not
against an animal living on a different diet and of an entirely different age group."
Angus notes that occasionally people will send in fiber samples in the hope that the
results will give them a marketing advantage over their competitors. To give
histogram results greater authenticity and integrity, Angus requests the age of the
animal and its ARI registration number, which are included on the histogram.
Identifying an alpaca and recording its age allows a knowledgeable person
scrutinizing a histogram to get a sense of how a particular animal stacks up against
others in the same age bracket. In addition, a potential buyer can supply the
registration number to the registry to verify the animal's age. Complete histograms
include a test date, which is also helpful. If age and registration number are not
included on the histogram, the test result's worth as an advertisement is greatly
diminished.
Only a few researchers have recorded how alpaca fiber changes under various
environmental conditions. George Davis of AgResearch in New Zealand reported at
the Australian Alpaca Association's International Alpaca Industry Seminar in 1994
that the fiber of a group of alpacas grazing on nutritious year-round pasture
increased on average about 3 microns a year, and individual animals had increases
exceeding 9 microns. Recent tests conducted by the Alpaca Registry have shown
that diet and other factors can drastically change histogram results in a matter of a
few months, even more dramatically than those recorded in New Zealand.
In 1997 this ARI screener was afforded the opportunity to test a group of
twenty-one alpacas (ten huacayas and eleven suris) on two occasions four months
apart during a period of radical dietary change. The results demonstrate that some
aspects of alpaca fiber measurement commonly recited on a histogram are easily
altered, while other measurements remain relatively constant.
In the test group the first fiber samples were collected shortly after the alpacas had
been transported from the altiplano at the end of the dry season, when natural
pastures are nutritionally depleted. All animals were sampled at the midpoint along
the flank of the primary blanket. The animals in question arrived in relatively good
body condition, with most scoring 2 or 3 on a 5-point body score (Table
1). Most
of the animals were tuis, in full fleece and not yet finished growing. By definition, tuis
produce the best-quality fleece each animal will ever produce because it is the
animal's first fleece. This group of tuis was shorn immediately following fiber
sampling. To maximize their growth potential, the animals were introduced to a
high-protein diet of unlimited amounts of high-grade alfalfa and a carefully regulated
grain/pellet supplement. Four months later fiber samples were collected from
twenty-one of these animals (ten huacayas and eleven suris). In the 4-month period
between the original sample and the second sample the animals had gained between
10 and 20 pounds (22 and 44 kg) and appeared to be robust and in excellent health.
Table 1. Difference between low- and High-Protein Diet
| Alpaca
ID # |
Avg.
Fiber Diam. |
Incr. |
Actl.
Micr. Incr. |
SD |
SD
after 4 mo. |
SD
Incr. |
%
over 30 |
Incr
after 4 mo. |
Incr. |
CV% |
CV
after 4 mo. |
| 1 |
20.8 |
25.9 |
5.1 |
5.0 |
5.8 |
0.8 |
5.0 |
20.7 |
15.7 |
24.0 |
22.4 |
| 2 |
24.4 |
27.2 |
2.8 |
5.4 |
6.6 |
1.2 |
13.0 |
28.8 |
15.8 |
22.1 |
24.3 |
| 3 |
21.8 |
22.8 |
1.0 |
4.9 |
5.5 |
0.6 |
6.3 |
9.4 |
3.1 |
22.5 |
24.1 |
| 4 |
18.1 |
21.3 |
3.2 |
4.5 |
5.6 |
1.1 |
1.9 |
6.9 |
5.0 |
24.9 |
26.3 |
| 5 |
23.4 |
22.4 |
-1.0 |
5.7 |
5.4 |
0.3 |
9.5 |
5.4 |
-4.1 |
24.4 |
24.1 |
| 6 |
20.4 |
24.3 |
3.9 |
5.3 |
7.1 |
1.8 |
5.7 |
12.2 |
6.5 |
26.0 |
29.2 |
| 7 |
18.8 |
19.9 |
1.1 |
4.4 |
5.1 |
0.7 |
2.1 |
4.3 |
-2.2 |
23.4 |
25.6 |
| 8 |
24.2 |
23.1 |
-1.1 |
5.6 |
5.5 |
-0.1 |
12.7 |
9.5 |
-3.2 |
23.1 |
23.8 |
| 9 |
23.0 |
27.0 |
4.0 |
5.6 |
9.2 |
3.4 |
9.1 |
24.0 |
14.9 |
24.3 |
34.1 |
| 10 |
23.4 |
25.9 |
2.5 |
5.4 |
6.4 |
1.0 |
9.0 |
20.5 |
11.5 |
23.1 |
24.7 |
| 11 |
21.6 |
25.4 |
3.8 |
4.9 |
5.9 |
1.0 |
5.3 |
18.4 |
13.3 |
22.7 |
23.2 |
| 12 |
19.3 |
20.3 |
1.0 |
4.9 |
4.7 |
-0.2 |
3.6 |
1.5 |
-2.1 |
25.4 |
23.2 |
| 13 |
20.2 |
23.9 |
3.7 |
5.3 |
5.9 |
0.6 |
5.2 |
14.5 |
9.3 |
26.2 |
24.7 |
| 14 |
23.2 |
24.6 |
1.4 |
5.0 |
5.9 |
0.9 |
8.3 |
14.4 |
4.1 |
21.6 |
24.0 |
| 15 |
24.5 |
28.8 |
4.3 |
5.6 |
7.3 |
1.7 |
13.8 |
40.4 |
26.6 |
22.9 |
25.3 |
| 16 |
22.5 |
22.6 |
0.1 |
4.0 |
4.8 |
0.8 |
2.9 |
6.7 |
3.8 |
17.8 |
21.2 |
| 17 |
21.9 |
25.0 |
3.1 |
4.4 |
5.5 |
1.1 |
4.4 |
16.8 |
12.4 |
20.1 |
22.0 |
| 18 |
25.2 |
28.0 |
2.8 |
4.3 |
5.3 |
1.0 |
10.2 |
31.1 |
20.9 |
17.1 |
18.9 |
| 19 |
18.7 |
27.8 |
9.1 |
3.8 |
6.5 |
2.7 |
1.1 |
31.9 |
30.8 |
20.3 |
23.4 |
| 20 |
23.3 |
27.6 |
4.3 |
5.1 |
6.7 |
1.6 |
7.5 |
27.6 |
20.1 |
21.9 |
24.6 |
| 21 |
20.0 |
26.7 |
6.7 |
5.2 |
5.5 |
0.3 |
4.2 |
23.5 |
19.3 |
26.0 |
20.6 |
|
Average |
21.8 |
24.8 |
3.0 |
4.0 |
- |
1.09 |
- |
- |
10.8 |
- |
- |
Summary
|
Micron
Change
|
| Original: 21.8 |
Retest: 24.8 |
Increase: 3 |
|
Standard
Deviation (SD)
|
| Original: 5.0 |
Retest: 6.0 |
Increase: 1 |
|
Coefficient
of Variation (CV)
|
| Original: 22.8 |
Retest: 24.3 |
Increase: 1.5 |
|
Microns
over 30
|
| Original: 6.7% |
Retest: 16.0% |
|
Though they had experienced rapid weight gain, none of the alpacas was obese. All
generally received a body score of 3 (optimum) on a 1-to-5 scale. Some had grown
an inch (2.54 cm) at the withers. The weight gains in such a short time were no less
remarkable than the changes in their histogram results during the same period. As a
group they experienced an increase of 3 microns in diameter, moving from an
average of 21.8 to 24.8 microns, with an individual animal skyrocketing 9 microns in
four months. The percentage of micron counts over 30 in the sample increased by a
whopping 10.7 percent, from 6.7 percent to 16 percent.
On the other hand, standard deviation (SD) and coefficient of variation (CV) proved
to be much more stable measurements under the changing conditions. On average,
standard deviation shifted upward by only 1 micron. Coefficient of variation was
practically as stable, showing a mild upward movement. Both measurements assess
uniformity (consistency), which is directly related to hair follicle development on the
skin, a characteristic primarily influenced by inheritance. Thus, these two
measurements are usually less influenced by environmentally stimulated changes than
micron count is.
By and large, most test results of samples taken by ARI during the screening
process are very similar to the results of pretests conducted by importers. However,
on occasion, an importer will challenge ARI�s results on some animals, claiming that
the same laboratory performed the tests and therefore the tests should yield the same
results. In many cases, dietary changes will account for the differing results.
There are other reasons for disparate results. In some cases the importer collected
samples haphazardly. One common error is to take samples at varying places along
the staple. For example, some sample cuts may be procured 2 inches from the skin
while others are near the skin. Another common error is to collect samples from
various sites on the animal rather than the recommended mid-side region. In one
case the importer took pencil-sized samples, rather than the 2 - square
-inch sample size recommended by Yocom-McColl, so the fleece would still look good. In other
situations, recently shorn animals with inadequate staple lengths had been sampled.
ARI samples all animals in the same manner, from the mid-side area of the blanket.
The sample is procured from as near the skin as is possible with portable
electric shears. To do it any other way would result in inconsistency, which should be
avoided in order to obtain accurate results.
It is worth remembering that the micron thickness of individual fibers along the
staple can vary up to 9 microns if the alpaca has undergone a significant dietary
change during the 12-month fleece-growing period. Consequently, if a sample is
taken an inch (2.54 cm) from the skin, the result may be significantly different from
that of a sample taken close to the skin. In fact, procuring a sample one-half inch
(1.3 cm) along the staple from the skin may result in a difference of 5 microns,
depending on numerous environmental factors that the animal may have
experienced.
There is no doubt that micron counts will likely increase with a richer diet, but that is
not always the case. Of the twenty-one animals in the ARI study, five increased in
microns only slightly and two actually decreased ever so slightly in average microns,
even though the animals rapidly increased in body weight. Micron reductions from
stress and diet are well documented, but the genetic predisposition of some animals
to change to a richer diet without appreciable effect on their coat fineness is not
understood. Alpacas whose dietary intake does not appreciably alter their average
micron count will undoubtedly attract the attention of breeders and researchers in the
years to come.
One alpaca born in California as a third-generation product of a North American
breeding program of Chilean ancestry is one such example. For reasons not
understood the animal defied an enriched diet, aging, and multiple
shearings. The alpaca averaged 19 microns at 18 months of age with a standard deviation of 3.4.
Four babies, five shearings, and six years later its micron count hadn�t changed.
Why?
ARI also conducted tests to attempt to determine how much variability existed
within a fleece. Most people know that the skirting, bib, and, to varying degrees, the
neck can be counted on to be coarser than the primary fleece or blanket area.
ARI focused its variability assessment on the blanket area. This was done by sampling
the same animal in different sites on the blanket at the same time. Samples were
always procured along the skin. This ARI screener took 10-inch-long swatches from
the midsection area of the blanket. The sample was then divided into three
equal parts and laser scanned. The results showed a great deal of consistency, with most
animals showing very slight variability of no more than 0.2 micron. However, two
animals showed about 1 full micron of variability in a 10-inch swatch.
Tests were also conducted (six animals chosen randomly) in which both sides (at
the midpoint) of the same animal were sampled and compared. Again, most animals
were consistent to within less than 0.2 micron from one side to the other. However,
two animals (one-third of the test group) showed a difference of nearly 1 micron
from one side to the other.
Today, most of us in North America are unlikely to avoid the use of laser scanning,
but we should learn to look at test results for what they are: the quality of the fleece
at the time of sampling. The value of the test results is that they indicate numerous
factors encompassing both the genetic quality of the fleece and numerous
environmental variables. It would be a mistake to rely solely on a histogram to make
comprehensive conclusions about an alpaca's fleece and the
animal's ultimate value. It takes a thorough education on essential fiber characteristics in conjunction with
wise use of information provided by histograms to steer a breeding program. The
histograms shown in Figures 1, 2,
3, and 4 provide illustrative examples.
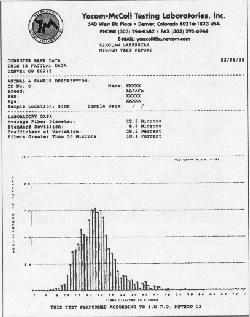
Figure
1This histogram appears to
indicate a desirable fiber test result.
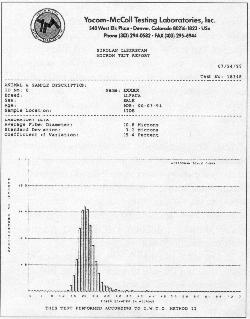 The
low micron count (20.8 microns) coupled with a low standard deviation
(3.2) is very desirable, as is a coefficient of variation of 15.
But the age of the animal at the time of the test needs to be considered
as well. Assuming the birth date is accurate, the animal was about
11 months old at the time of the test , which is young when compared to
a tui (18-24 months), the age group most commonly sampled and shorn for
the first time. The fiber of an animal sampled this young will
likely coarsen by a few microns by the time of first shearing. The
animal's diet in the months prior to testing and comparative data of
other animals would help in the assessment of this histogram. The
low micron count (20.8 microns) coupled with a low standard deviation
(3.2) is very desirable, as is a coefficient of variation of 15.
But the age of the animal at the time of the test needs to be considered
as well. Assuming the birth date is accurate, the animal was about
11 months old at the time of the test , which is young when compared to
a tui (18-24 months), the age group most commonly sampled and shorn for
the first time. The fiber of an animal sampled this young will
likely coarsen by a few microns by the time of first shearing. The
animal's diet in the months prior to testing and comparative data of
other animals would help in the assessment of this histogram.
Information necessary
for a full histogram is also missing. The owner failed to provide
the alpaca's Alpaca Registry Identification Number, which may mean an
animal so casually identified may not necessarily represent the sample
shown in the histogram. Because the animal isn't precisely
identified, any additional information sought from the registry cannot
be retrieved, nor is there any verification that the animal is actually
registered. In addition, this test lacks the "fibers greater
than 30 microns" score, which indicates the prickle factor.
The prickle factor and presence of guardhair are carefully monitored in
all luxury fibers , not just alpacas; fiber processors generally agree
that microns over 30 irritate human skin, hence the name prickle
factor. A histogram with favorable results , such as this one
for a tui, would identify a truly superior animal if the fleece
weight were 7 to 8 pounds.
|
Figure
2
This test result is favorable
in all test areas, although the coefficient of variation is a little
high.
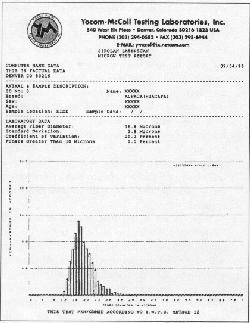 However,
the date of the sample and the alpaca's birthdate are not indicated,
nor is the Alpaca Registry Identification Number, meaning that this
histogram is useful for internal ranch management purposes but
unsuitable as a complete histogram for purposes of verifying fiber
quality to a prospective customer wanting to purchase the animal. However,
the date of the sample and the alpaca's birthdate are not indicated,
nor is the Alpaca Registry Identification Number, meaning that this
histogram is useful for internal ranch management purposes but
unsuitable as a complete histogram for purposes of verifying fiber
quality to a prospective customer wanting to purchase the animal.
|
Figure 3
This vicuna (Vicugna vicugna) sample offers a study in fineness, an average fiber diameter
(AFD)
of 12.5 microns.
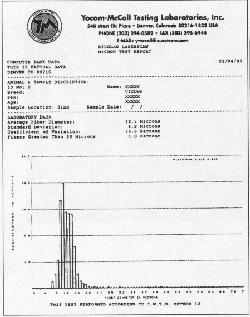 At
an AFD this low, a standard deviation of 4.2 is high, indicating that
even though the micron count is very low that sample has a significant
amount of variability. The degree of variability is dramatically
expressed in the 33.6 coefficient of variation, which testifies to the
medullated hair in vicuna fleece that is generally removed in a
dehairing process. Still medullated hairs are so fine in this
sample that only 1 percent of the sample was over 30 microns, which is
superior to most alpacas. Superfine animals such as vicuna and
some alpacas often have diminished fleece weights. In vicunas a
fleece usually is about 1 pound and regrowth occurs at a rate of about
1/3 inch a year. Annual regrowth of 6 inches and fleece weights of
4 to 8 pounds are common in alpacas. At
an AFD this low, a standard deviation of 4.2 is high, indicating that
even though the micron count is very low that sample has a significant
amount of variability. The degree of variability is dramatically
expressed in the 33.6 coefficient of variation, which testifies to the
medullated hair in vicuna fleece that is generally removed in a
dehairing process. Still medullated hairs are so fine in this
sample that only 1 percent of the sample was over 30 microns, which is
superior to most alpacas. Superfine animals such as vicuna and
some alpacas often have diminished fleece weights. In vicunas a
fleece usually is about 1 pound and regrowth occurs at a rate of about
1/3 inch a year. Annual regrowth of 6 inches and fleece weights of
4 to 8 pounds are common in alpacas.
|
Figure 4
If the owner of the alpaca in
this test cited the resulting micron count as desirable, he would be
accurate, but that is not the only consideration.
 The
other test results are not favorable for an alpaca of any age. The
standard deviation is high for an animal with a micron count this
low. This disparity between the average fiber diameter and
standard deviation is reflected in the coefficient of variation, the
measurement that combines standard deviation and micron count. A
coefficient of variation near 20, and preferably lower, is
desirable. A coefficient of 29.2 is excessive and indicates a
great deal of variability in the sample. The extent of this variability
is further reflected in the "fibers greater than 30 microns"
score: 10.4 percent of the fibers are greater than 30 microns,
indicating a great deal of course medulated fiber and an undesirable
prickle factor. The
other test results are not favorable for an alpaca of any age. The
standard deviation is high for an animal with a micron count this
low. This disparity between the average fiber diameter and
standard deviation is reflected in the coefficient of variation, the
measurement that combines standard deviation and micron count. A
coefficient of variation near 20, and preferably lower, is
desirable. A coefficient of 29.2 is excessive and indicates a
great deal of variability in the sample. The extent of this variability
is further reflected in the "fibers greater than 30 microns"
score: 10.4 percent of the fibers are greater than 30 microns,
indicating a great deal of course medulated fiber and an undesirable
prickle factor.
|
Copyright � 1998 by Eric Hoffman.

|